- 0413 917 722
- contact@zeroexposure.com.au
- Mon - Fri: 9:00 - 17:00

A lot of people get bored by statistics, but they are real. Especially these ones. Since January 2017 to 26 April 2017 there has been a staggering 51 workplace deaths. That is one every 2.2 days! So following these statistics there has likely been 2 fatalities this week. 2 workers that have not returned home to their families. 2 workplaces that have been significantly affected by the death of their workmate. The impact these 2 fatalities have a on our society is significant, it becomes a spider effect. It is not just the families and workers, it’s the doctors, paramedics, police, safety professionals etc. Ensure your business is fully across what the health and safety legislation in your jurisdiction requires and keep your workers and your work environment safe. If you need further assistance with this please contact me today for a free 30 min no obligation chat.
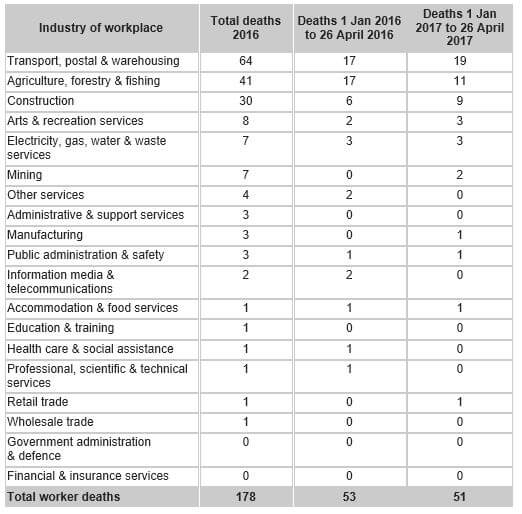
| Industry of workplace | Total deaths 2016 | Deaths 1 Jan 2016 to 26 April 2016 | Deaths 1 Jan 2017 to 26 April 2017 |
| Transport, postal & warehousing | 64 | 17 | 19 |
| Agriculture, forestry & fishing | 41 | 17 | 11 |
| Construction | 30 | 6 | 9 |
| Arts & recreation services | 8 | 2 | 3 |
| Electricity, gas, water & waste services | 7 | 3 | 3 |
| Mining | 7 | 0 | 2 |
| Other services | 4 | 2 | 0 |
| Administrative & support services | 3 | 0 | 0 |
| Manufacturing | 3 | 0 | 1 |
| Public administration & safety | 3 | 1 | 1 |
| Information media & telecommunications | 2 | 2 | 0 |
| Accommodation & food services | 1 | 1 | 1 |
| Education & training | 1 | 0 | 0 |
| Health care & social assistance | 1 | 1 | 0 |
| Professional, scientific & technical services | 1 | 1 | 0 |
| Retail trade | 1 | 0 | 1 |
| Wholesale trade | 1 | 0 | 0 |
| Government administration & defence | 0 | 0 | 0 |
| Financial & insurance services | 0 | 0 | 0 |
| Total worker deaths | 178 | 53 | 51 |
